How Do Sports Campaigns Perform? Key Stats for 2018-2022 + Forecast
Only those who are conscious of the past can build a future. Well, this proverb is totally relevant to sports campaigns! And today, let’s imagine that we are sci-fi characters or magicians and time travel to see how soccer-related campaigns performed before. Like real fortune tellers, we will uncover and analyze trends to see what is waiting for us in the nearest future.
So, we decided to overview four different sports events of various years:
- FIFA World Cup 2018 – 14 June – 15 July
- Euro 2020 – Jun 11, 2021 – Jul 11, 2021
- FIFA Club World Cup 2021 – 3 – 12 February 2022
- Champions League 2022 – 21 of June – 21 of June – 28 of August (the day we checked the stats) 2022

We will take a look at statistics, namely GEOs, ad formats, and verticals that were the most and the least profitable. Let’s start!
FIFA World Cup 2018 – 14 June and 15 July
- Host country: Russia
- Teams: 32
- Champion: France
- Attendance: 3,031,768 (47,371 per match)
- Live viewers: 1,12 BLN
Verticals
So, in distant 2018 the FIFA Club World Cup was a fruitful time for these top verticals:
| Verticals | Impressions | Clicks | Conversions |
| Utilities | 2 908 008 299 (+283 138 092) | 7 159 293 (+6 339 832) | 15 478 264 (+7 247 150) |
| Software | 159 184 198 (+62 416 767) | 304 484 | 169 355 (+57 285) |
| iGaming | 1 131 475 894 (+207 756 508) | 5 104 656 | 82 985 |
iGaming, Utilities, and Software showed great results and growth. As our Sales Team members claim, these verticals are exceptionally relevant for sports campaigns. We will remind you the reasons why!

Well, the success of iGaming doesn’t really need too much explanation: fans eagerly deposit money for their favorite teams during matches, because this is the hottest time to do so.
Utilities and Software, which includes dozens of offers like anti-viruses, ad blockers, and VPNs, grew, as well. They are exceptionally useful for watchers – people really want to get rid of ads, use VPNs to access live streaming, and make sure that they watch matches online safely with anti-viruses.
To analyze the tendency, we will also take a look at the least profitable verticals:
| Verticals | Impressions | Clicks | Conversions |
| Games | 260 188 265 (-92 846 092) | 1 576 350 (+398 377) | 158 158 (-18 486) |
| Finance | 1 091 089 272 (+189 322 351) | 5 669 794 (-865 054) | 93 340 (-6 121) |
| Dating | 157 161 613 (-100 065 491) | 26 714 (+16 269) | 60 317 (+22 131) |
Games lost their popularity and our Sales Team suggests that this happened because people switched to iGaming instead. Dating didn’t seem to be a success this year either. Also, Finance offers were not too profitable – again, it seems like football fans were more interested in deposits than trading, loans, or credit cards. You either spend money on this or that!
GEOs
As for the GEOs, we have to mention that people all over the world watch matches like the World Cup (any of them, every year), but we still have some interesting numbers to share. Some may surprise you.
| GEOs | Impressions | Clicks | Conversions |
| Germany (DE) | 432 071 369 (+47 361 035) | 5 403 083 (+2 968 528) | 131 730 |
| Italy (IT) | 429 906 665 (+63 228 050) | 7 205 062 (+4 458 849) | 179 830 |
| Netherlands (NL) | 110 043 441 (+13 319 853) | 8 311 370 (+6 051 785) | 40 708 (+4532) |
Germany and Netherlands participated in the World Cup 2018, while Italy failed to qualify after losing to Sweden in a two-legged playoff. As you can see, testing is everything – even non-participating GEOs can bring significant results!

How interesting: two of the four most profitable GEOs had the most active fans, even though their teams were not participating! Basically, we can claim that such matches are extremely popular in all countries, and statistics prove that. All in all, for example, people from Germany and Italy are fond of football as a whole, or they can also be in some other football clubs.
Now let’s check which GEOs were less successful:
| GEOs | Impressions | Clicks | Conversions |
| Indonesia (ID) | 1 884 895 529 (-40 218 672) | 124 014 098 (-127 754 431) | 725 646 (+177 467) |
| Myanmar (MM) | 61 033 614 (-35 008 963) | 1 555 510 (-581 529) | 74 327 (+2 944) |
| Ukraine (UA) | 221 186 492 (-22 485 888) | 1 857 772 (-1 824 836) | 157 758 (+34 086) |
| South Africa (ZA) | 220 646 602 (+17 522 776) | 3 534 509 (+667 935) | 214 202 (-44 821) |
None of these countries were involved in the event and it seems like locals are not as active as German or Italian buffs – they don’t really watch everything.
Ad formats
| Format | Impressions | Clicks | Conversions |
| Onclick | 14 199 758 887 (+889 984 366) | 501 520 047 (-52 400 574) | 22 713 994 (+7 121 175) |
| Push | 9 425 528 724 (+1 854 934 569) | 67 095 401 (+8 490 981) | 173 509 (+39 419) |
| Interstitial | 498 150 973 (+442 084 082) | 5 381 068 (+4 848 012) | – |
All three formats showed great results, especially Onclick. Basically, as we can see from the stats, all PropellerAds formats are efficient when it comes to sports campaigns.
Takeaways:
During the World Cup 2018, the best results were achieved this way:
- Utilities, Extensions, and iGaming were the most converting verticals.
- Tier-1 countries targeting – as we see, Italy, Germany, and the Netherlands are on the top of the list.
- All ad formats – Push, Interstitial, and Onclick – brought significant results.

Euro 2020 – Jun 11, 2021 – Jul 11, 2021
- Host country: 11
- Teams: 24
- Champion: Italy
- Attendance: 1,099,278 (21,554 per match)
- Live viewers: 5.23 BLN
Let’s see how verticals performed during Euro 2020:
| Verticals | Impressions | Clicks | Conversions |
| iGaming | 8 385 643 575 (+2 859 113 493) | 19 717 984 (+6 085 522) | 199 030 (+25 134) |
| Surveys | 1 171 107 407 (+395 026 456) | 5 789 740 (+2 117 491) | 1 200 442 (+335 804) |
| Sports content | 8 646 872 581 (+180 234 806) | 17 056 232 (+4 835 756) | 432 153 (+141 795) |
| Mobile content | 523 814 524 (+24 746 467) | 2 915 379 (+646 498) | 742 118 (-9 121) |
iGaming performed exceptionally well, showing growth by all measures. Other top verticals on our list are Surveys, Sports content, and Mobile content. In addition to classic Surveys and Mobile content, there are numerous football-related offers in all of these categories, like these tricky sports questions or subscriptions for online games, which might have been extremely relevant during the match.
And these verticals eventually dropped:
| Verticals | Impressions | Clicks | Conversions |
| Utilities | 1 428 842 599 (-1 387 935 572) | 23 009 119 (-4 471 908) | 3 027 451 (-986 716) |
| Finance | 26 779 965 035 (-3 308 115 856) | 50 727 964 (-10 175 242) | 915 515 (-260 755) |
| Dating | 83 715 502 892 (+6 588 563 539) | 203 827 455 (-724 434) | 1 337 800 (+282 539) |
| Mobile content | 141 377 149 (+7 268 508) | 284 778 (+196 508) | 69 010 (-172 605) |
Unlike in 2018, this time, to our surprise, Utilities dropped. But the same happened to Finance and Dating. Also, Mobile content showed low numbers. You don’t have to take a wild guess – try different CPA offers from various verticals even before the match to see which one is trendy this year!
GEOs
Let’s see the situation with growing GEOs during Euro 2020:
| GEOs | Impressions | Clicks | Conversions |
| Brazil (BR) | 16 417 787 683 (+1 822 574 415) | 46 567 141 (+2 833 561) | 5 486 949 (+1 381 028) |
| Ukraine (UA) | 2 024 178 383 (+242 550 998) | 1 934 305 (-133 964) | 6 930 268 (+5 385 416) |
| USA (US) | 6 950 249 184 (-133 416 305) | 24 473 516 (-35 850) | 2 404 543 (-688 741) |
| Philippines (PH) | 11 002 231 581 (+2 937 467 098) | 35 459 894 (+3 934 326) | 4743 163 (+1 228 445) |
BR is on the top of our list, well, nothing unexpected here – this GEO is ever-green for football campaigns. Seems like locals watch almost every significant match, even if their country doesn’t take part. Note that!

UA is the second best performing GEO during Euro 2020. For this GEO, it is quite understandable – the local team took part in the tournament, and many Ukrainians were cheering for their players.
US and PH teams were not participating, but we can still include these two GEOs in the list of the best performers. This is something you can find out after rolling a couple of tests, so remember how important it is.
And now the less successful GEOs:
| GEOs | Impressions | Clicks | Conversions |
| India (IN) | 60 917 577 181 (+4 755 266 002) | 132 170 252 (-15 269 733) | 14 896 916 (-4 059 230) |
| Italy (IT) | 4 047 860 638 (+274 748 866) | 8 109 159 (+618 428) | 772 122 (-23 476) |
| Japan (JP) | 1 863 319 391 (+213 543 865) | 4 572 593 (-54 823) | 1 785 029 (+911 445) |
| Saudi Arabia (SA) | 2 637 783 841 (-213 142 537) | 6 065 702 (-522 686) | 574 008 (+61 902) |
More surprises! India, the GEO known for its love of football, eventually dropped during Euro. From the LiveMint research, we found out that actually, 37 million Indian fans watched the show, which is three times more than the viewership of Euro 2016. And here is the nuance – Indians watched the tournament on TV, via Sony Pictures Sports Network (SPSN). We suggest that Indians used to get TV subscriptions after COVID-19 started and haven’t changed that habit yet.

This is when we realized why some GEOs expected to be profitable may drop all of a sudden sometimes. People prefer different ways to enjoy the match!
IT, which actually was the champion of this tournament, also shows dropped numbers. As SportsProMedia writes, just like in India, Italian people watched the match on TV. The total number of viewers was about 18.2 million, equivalent to a 73.7 percent market share. The same was true for England, another significant participant of the tournament, which we didn’t see on the list of best-performing GEOs. They had a really hot match with Italy and 30.95 million English viewers saw it.
Other two dropped GEOs are JP and SA. In our opinion, these regions are mostly interested in local games and matches where their teams take part.
Ad formats
How about ad formats? Let’s see what the numbers show:
| Format | Impressions | Clicks | Conversions |
| Onclick | 11 231 639 751 (+192 483 898) | – | 35 949 626 (-597 763) |
| Push | 253 845 027 246 (+11 415 894 705) | 615 584 920 (+2 563 422) | 15 920 520 (+231 570) |
| Interstitial | 1 865 279 546 (+200 073 738) | 87 509 622 (-16 504 675) | 793 095 (-21 847) |
Interstitials and Push notifications did a really great job. If we come back to the verticals that performed the best, we can see the correlation between the format and offer categories. From our experience, iGaming works efficiently with Push, while Onclick is the best format for Surveys. And voila – two best-performing verticals, and two most-profitable formats work great together.
Takeaways:
Some conclusions we can make from the statistics:
- Verticals – iGaming was a leading vertical during Euro 2020, being the most relevant for sports events. Unlike in 2018, this time, Utilities dropped significantly, as well as Finance offers.
- GEOs – BR is a win-win option for almost every sports event, which was also true for Euro 2020. UA performed great because it was an important match for the locals, who used to watch it online, unlike IT or US, who switched to TV instead of the Internet.
- All ad formats – Push, Interstitial, and Onclick – brought significant results.
FIFA World Cup 2021 – 3 – 12 February 2022
- Host country: United Arab Emirates
- Teams: 7
- Champion: Chelsea
- Attendance: 100,752 (12,594 per match)
- Live viewers: 5 BLN
Now, we move to the FIFA World Cup of 2021. Traditionally, we start with verticals:
| Verticals | Impressions | Clicks | Conversions |
| iGaming | 2 126 959 326 (+307 718 151) | 4 711 635 (+598 988) | 82 327 (-93 448) |
| eCommerce | 6 950 018 815 (+997 955 316) | 5 014 082 (-15 957) | 722 175 (+171 870) |
| Dating | 2 811 810 343 (-319 677 211) | 6 515 321 (-304 747) | 52 151 (-6 310) |
| Surveys | 218 268 261 (-63 909 731) | 948 423 (-12 488) | 858 532 (-125 521) |
Again, iGaming is a real champion with the best results. The second one is eCommerce, which we didn’t see in the leaders before, unlike iGaming.

We think that this leap happened because of the approaching Valentine’s Day – chances are that numerous football fans were interested in buying gifts for their girlfriends and boyfriends. So, keep that in mind – check the holidays that may coincide with the sports events and make a mixture in your campaign to get even more profit. Be flexible!
Dating and Surveys also showed good revenue growth, even though they dropped in impressions, clicks, and conversions. So, we can see that Dating and Surveys interest football fans from match to match, and these two verticals don’t really leave the stage.
Now let’s move to the less successful categories:
| Verticals | Impressions | Clicks | Conversions |
| Utilities | 498 666 342 (+28 308 077) | 5 921 220 (-141 966) | 1 076 400 (-150 609) |
| Sweepstakes | 8 079 054 302 (-266 357 509) | 18 804 116 (-1 474 380) | 953 442 (-153 390) |
| Finance | 10 370 031 490 (-256 790 324) | 14 325 808 (+596 847) | 408 090 (-38 136) |
We can see Utilities, Sweeps, and Finance offers dropped. As during Euro 2020, Utilities didn’t perform well, but they were trendy in 2018. So, current trends matter! While Finance, according to our previous stats, was not popular these years. But we must look further, this vertical is not hopeless, as you will see later in our research.

GEOs
Meet the GEOs with the best results achieved during FIFA World Cup 2021:
| GEOs | Impressions | Clicks | Conversions |
| South Africa (ZA) | 1 076 054 963 (-37 714 294) | 6 471 326 (+287 012) | 1 289 666 (-181 630) |
| USA (US) | 2 470 289 932 (-6 040 778) | 8 870 673 (-34 494) | 654 941 (-55 819) |
| Nigeria (NG) | 1 054 734 725 (+80 932 993) | 5 217 904 (+219 829) | 884 346 (+51 998) |
| Great Britain (GB) | 619 554 126 (-3 901 628) | 2 017 875 (+75 556) | 183 131 (-13 568) |
What a mix! Tier-1, Tier-2, and Tier-3 GEOs are on the top! So, the tendency is… flexibility and multi-GEO. Indeed, this means that you can launch campaigns for both expensive and affordable countries – all Tiers are included in the top list. Just make sure you create a separate campaign for every GEO, since a different approach is required to each.
Seems like we have eCommerce on the list of best performers because they were popular in the US and GB, while Surveys skyrocketed in ZA and NG. Dating and iGaming are popular everywhere, though.
Interesting fact – only the GB team (which is actually Chelsea, the tournament winner) took part in the match, unlike all the other GEOs in the table. Well, Chelsea and English football as a whole have millions of admirers and thousands of fan clubs all around the world, which might be the reason for such a GEO mix.
And now the GEOs that didn’t bring any significant results (oh, we have surprises here, as well):
| GEOs | Impressions | Clicks | Conversions |
| Brazil (BR) | 6 178 448 475 (-444 367 731) | 13 514 485 (-258 424) | 7 295 477 (-2 926 594) |
| Philippines (PH) | 6 376 441 309 (-462 949 810) | 11 339 333 (-1 168 930) | 1 720 476 (-283 172) |
| Malaysia (MY) | 3 391 617 231 (+47 078 847) | 3 135 770 (-353 477) | 429 550 (-76 766) |
| Colombia (CO) | 1 894 701 775 (-189 046 945) | 3 354 764 (-296 790) | 471 349 (-204 035) |
It’s the first time BR dropped, even though the local team participated in the match, as well as LATAM and Asian GEOs in general. Seems like this match was not popular around these countries, even though we saw significant results before. But, as it becomes clear, trends and best performers vary from match to match, which means that you should keep on testing! There are no obvious things in affiliate marketing, right? Just practice.

Ad formats
This time, ad formats didn’t show any significant growth, but the reason was our internal SSP (self-serve platform) rearrangements. Still, we have some numbers to share:
| Format | Impressions | Clicks | Conversions |
| Onclick | 4 420 844 338 | – | 12 888 193 |
| Push | 99 390 701 954 | 183 597 658 | 5 700 652 |
| Interstitial | 492 672 287 | 35 907 342 | 984 180 |
Push notifications stay the best-performing format over the years! Also, Onclick showed high numbers – we believe that this format was efficient in combination with eCommerce offers, since it’s great for offers that require detailed descriptions and product images.
Takeaways:
During the FIFA World Cup 2021, we noticed that:
- iGaming, eCommerce, Dating, and Surveys performed the best. While iGaming success during football events doesn’t require any explanations, eCommerce must have been that profitable because it was almost the 14th of February. Dating and Surveys also prove to be top verticals for sports events, so mind them.
- During this period, we literally had a cocktail of various GEOs: ZA, US, NG, and GB performed the best. And these are countries from all Tiers! Conclusion: football matches are so universal, that you can be creative with your GEO choice.
- As for ad formats, this time, Push was ahead of all the rest. So, choose Push, and this won’t be a mistake.
Champions League 2022 – 21 of June – 10 June 2023
- Final host: Turkey
- Teams: 32
We were retrieving these stats on the 22nd of August, so the Champions League 2022 was still happening. Still, we could make some interesting conclusions about event-related campaigns and their performance and even make some forecasts.
Verticals
| Verticals | Impressions | Clicks | Conversions |
| Dating | 11 334 485 311 (+6 525 562 870) | 22 377 613 (+13 361 296) | 123 651 (+55 933) |
| iGaming | 43 427 435 270 (-2 805 758 490) | 62 274 537 (-911 549) | 1 277 731 (+465 805) |
| Finance | 42 932 629 224 (-451 269 780) | 83 149 156 (+4 400 140) | 2 860 741 (+488 755) |
Surprisingly, Dating got really popular and became a winning vertical for sports. Who would have thought that Dating will grow that much! So, sometimes even unexpected verticals are worth testing. Also, iGaming (of course) and Finance offers showed great results regarding revenue growth.
In 2018, both Finance and Dating were on the list of dropped verticals. In 2022, we have quite an opposite story. Fancy that!
And here is our rating of the least profitable verticals:
| Verticals | Impressions | Clicks | Conversions |
| Utilities | 3 277 749 521 (-109 689 253) | 43 479 667 (-3 804 414) | 5 806 363 (-816 008) |
| Software | 170 979 850 (-346 502 855) | 1 095 833 (-7 779 485) | 329 268 (-147 281) |
| eCommerce | 25 339 854 686 (-833 251 517) | 27 120 033 (-6 969 932) | 6 201 289 (+183 671) |
How interesting! Again, we see Utilities and Software dropping. However, to be honest, we are not sure that the categories are somehow problematic. We asked our Sales Team what has happened to Utilities and Software this year, and they suggest that it was not about the verticals, but rather a bit of subsided monetization on the advertisers’ side.

GEOs
| GEOs | Impressions | Clicks | Conversions |
| Brazil (BR) | 29 718 966 886 (-6 124 721 539) | 66 244 206 (-1 365 882) | 12 303 465 (+4 413 519) |
| Indonesia (ID) | 66 977 254 143 (-13 907 832 635) | 114 105 893 (-5 557 869) | 17 462 712 (+245 080) |
| Philippines (PH) | 25 941 440 478 (-11 387 736 088) | 54 440 821 (+2 074 450) | 8 207 831 (+1 823 415) |
| Vietnam (VN) | 27 712 888 543 (-10 831 946 737) | 31 069 281 (+791 224) | 2 753 335 (-9 946 841) |
The top GEO is Brazil, even though the local team doesn’t take part in the championship. Still, Brazilians are a real nation of football lovers, so it’s no wonder they watch such huge matches as Champions League. Football is the most popular sport in the Philippines, Vietnam, and Indonesia, as well. That’s why, these GEOs are also the best-performing even though their teams are not participating.
As for the GEOs of playing teams, we noticed only UA, IT, and ESP among the growing GEOs. While in general 55 countries were on the field!
We can conclude that targeting GEOs where football is popular makes sense almost all the time – most likely, users will watch most of the matches, disregarding the playing teams’ origin. As for the playing GEOs, you should try targeting them on the concrete days – particularly when their team is on air.
We didn’t see any significantly dropped GEOs to show you, so let’s move to the ad formats:
| Format | Impressions | Clicks | Conversions |
| Onclick | 23 505 263 977 | – | 73 013 072 (+5 993 420) |
| Push | 483 539 818 808 | 1 051 034 939 | 31 673 705 |
| Interstitial | 2 531 436 036 | 190 120 264 | 3 938 903 |
From our statistics, this time all formats showed modest growth during the Champions League. Still, Push showed considerable results in impressions, clicks, and conversions, while Onclick grew in terms of conversions.
Gradually, we moved to the concluding part of our research, so let’s see what we have.
Summing up
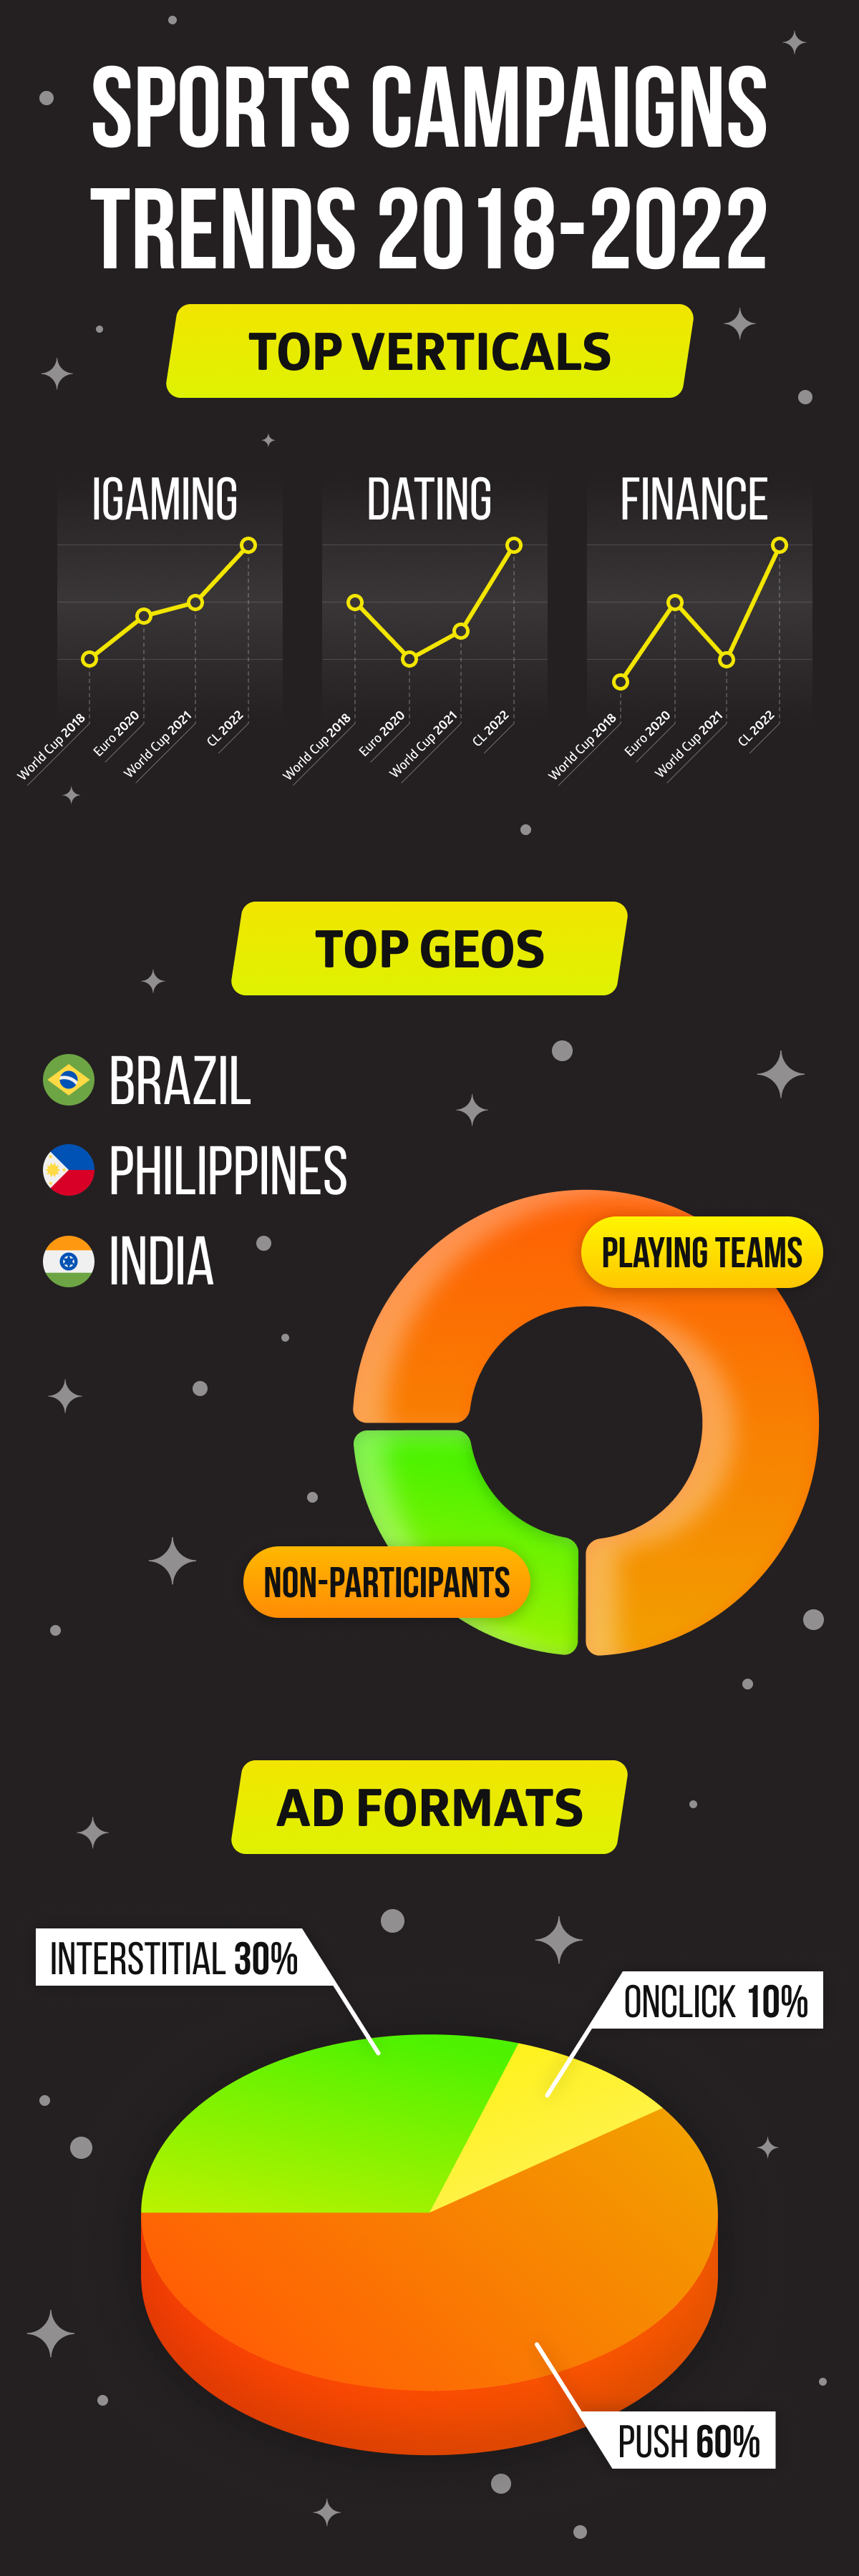
We reviewed four significant matches of different years to see how sports campaigns changed over time. In general, we see that different GEOs and verticals show great results, and sports events are associated with a revenue bounce, so every affiliate has a chance to earn. Here are all of our main findings visualized:
Our main advice: launch a couple of tests before a match (2-3 days maximum) to see which vertical and GEO will bring you the best results. Our research shows that you can never guess which combination will make your wallet thicker – trends vary from year to year.

So, what was going on with verticals?
In 2018, we saw a boost in Utilities and Extensions, which was no more the case for the rest of sports events. On the contrary, Finance and Dating trailed somewhere far behind until the Champions League 2022. An important point to mention – for Dating, affiliate marketers started using more tempting images without breaking the policies (like, ladies in swimsuits), which might be a reason for such success.
eCommerce performed great when the match coincided with Valentine’s Day preparations. This is a small trick for you to keep in mind – whenever matches overlap holidays, you should try launching eCommerce offers.
At the same time, iGaming has always been the top vertical for all matches of all years.
And GEOs?
We noticed a really interesting mix of GEOs throughout different events. As we found out, sometimes, GEOs of playing teams are not at the top, but why? We have a suggestion here. The match is super-important for fans from the playing countries. That is why they might be less attentive to the ads, with their attention totally fixed on the game.
Also, we noticed that after the COVID-19 pandemic, people got used to TV streaming services, so even when the official viewers’ statistics was huge, we didn’t see a significant rise in our statistics.
In most cases, Brazil, the Philippines, and India show high results disregarding which match is on air.
What about ad formats?
Push, Push, and Push again! All years and all matches on Push were the most profitable. Also, we saw a significant increase in Interstitial traffic in 2018 and Onсlick in 2021 and 2022.
Our forecast
So, regarding the tendencies, we can highlight the following forecast for the nearest sports events:
- Top verticals: iGaming, Dating, Finance (maybe, Utilities will become great again, especially, for the countries with restricted access to online content);
- Top GEOs: Brazil, the Philippines, and India show potential for almost any match. As for playing GEOs, indeed, sometimes they perform great, sometimes – not really. Before launching a campaign for a playing GEO, do your small research and see if locals prefer watching matches online, on a TV, or even outside;
- Top formats: Choose Push or/and Onclick, and you won’t make a mistake.
So, that’s all, folks! We wish you profitable sports campaigns and see you soon!
Let’s discuss our research in PropellerAds’ Telegram chat!
Trends
View more posts