Viewability Metrics: Using Them in a Real-Life Campaign
Please mind that the Viewability metrics we mention in this article is discontinued and no longer available in PropellerAds accounts.
Hey stat lovers and data junkies!
A couple of weeks ago, we released a pretty intriguing feature – Viewability Pixel. Today we’d like to show you how you can use the Viewability data in a real-life campaign and drop some spoilers about the feature’s upcoming upgrades.
Quick Viewability Recap:
Viewability is the metric we’ve recently added to your campaign statistics. It shows how interested in your offer/landing page visitors are. It has 2 parameters: Engaged Visits and Engaged Visits %.
- Engaged Visits is the number of users who came to your landing page, and spent more than 2 seconds there (probably read the ad copy, researched the offer).
- Engaged Visits % is the same number of users but compared to the overall number of impressions/clicks of your ads.
When is the Viewability Pixel a must-have?
- When you don’t have access to the conversion data, but you still need to optimize campaign performance.
- When you have really expensive conversions and complicated flow and need to start optimizing before the conversion data is gathered.
- When you want more data about your audience & traffic.
What can Viewability metrics tell you?
The Viewability Pixel is designed to help you track the behavior of your audience on the landing page or a pre-lander and see if the traffic you are buying is relevant to your offer.
You can break down the viewability statistics by zones and see, which placements bring the most and the least engaged users to your landing page.
Based on this info, there are 2 main scenarios of optimization by the audience:
- You discover ad placements (zones) that drive highly interested audiences, collect the zone IDs into a whitelist, target them in a separate campaign.
- You discover ad placements that have significantly lower Engaged Visits % than your campaign’s average “Engaged Visits %” score (our system will also automatically mark such zones). You can exclude these zones.
For both scenarios, we need to be sure that the Viewability data correlates with the conversion data. Let’s check if you can trust your Engaged Visits and if the zones with low Viewability percentage are the ones bringing no or not enough conversions.
Viewability test-drive
For the test, we asked one of our affiliates to use the Viewability Pixel in his campaign and share his stats with us. The campaign’s settings were the following:
Offer
Virus Hunter – a utility offer (find it in Zeydoo) with an easy conversion flow and CPI = $0.02.
We asked to pick a simple offer not to wait too long for the conversions.
Targeting
| Format: Onclick/Popunder ads Bidding model: SmartCPM GEO: India Targeting: Android Test period: 20/03 – 23/03 |
Important to have
- Access to your landing page or pre-lander
- An https-based landing page
- Targeting excluding Safari browser
The statistics we got from our partner after 3 days of the test.
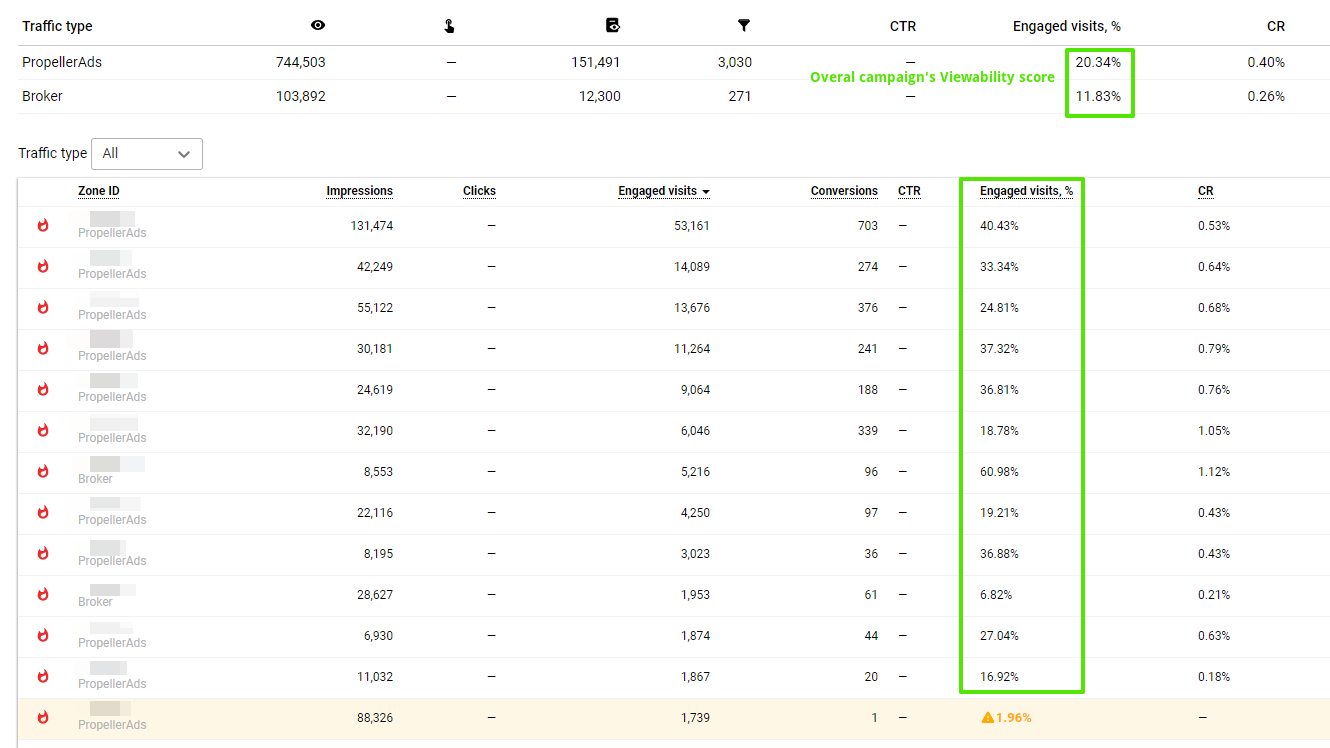
We’ve sorted the zones by the “Engaged Visits” column (descending from more visits to fewer) and made sure the zones have enough impressions for statistically valid conclusions. So let’s see which insights we can get from the Viewability data.
#1 How relevant is the traffic in general?

The average “Engaged Visits,%” rate for this campaign can be found on top of the table. In our case, it’s 20.34% for Propeller direct traffic and 11.83% for all Broker zones.
#2 High “Engaged Visits,%” rate = more conversions?
Let’s now look at the top-12 zones of the table. All the placements with the high “Engaged Visits, %” rate have a good number of conversions and a solid CR for provided volumes.
The highest “Engaged Visits %” rate among the big zones is 40.43% Almost half of the audience coming from this zone is interested in our landing page, which results in 703 conversions. Very nice for a 3-day test, right?
Another interesting highlight is a 60.98% “Engaged Visits, %” rate on a small broker zone. Its viewability is great and the conversion rate is a solid 1.12%. Although broker traffic is often underestimated, rare finds like this can be game-changing in the pursuit of cheap quality leads. Don’t miss them out!
#3 Low “Engaged Visits,%” rate = fewer conversions?
Let’s now look at the zones with low viewability and check their conversion rate. To find them, you can manually sort the stats for the lowest “Engaged Visits, % rate” or look for the alerts our system provides.
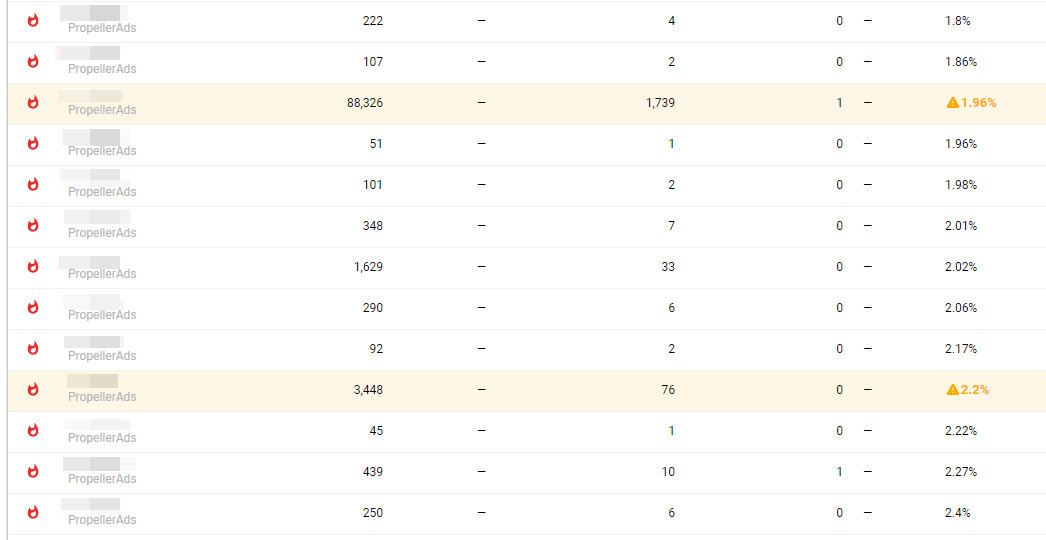
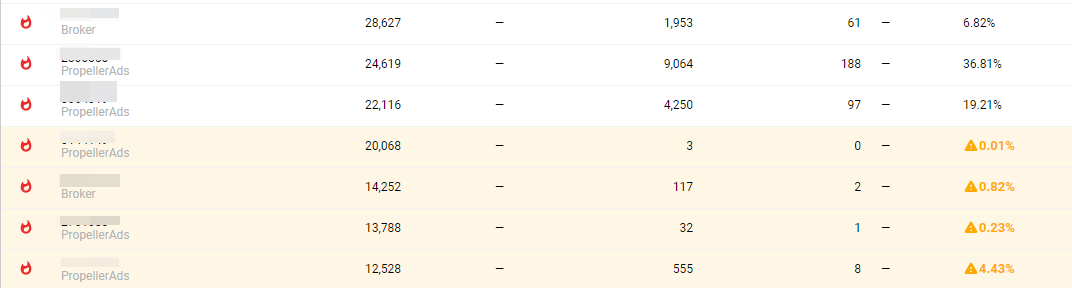
When the number of impressions and clicks is growing, and the “Engaged Visits, %” rate stays low (less than ¼ of the average campaign viewability), our system registers weak user engagement and alerts you. You will see an exclamation mark and an orange highlight next to such zones. It might be a good idea to exclude them during optimization.
And what’s with conversions there? They occur, but the CR is very low. The zones marked by our system have very few or no conversions at all.
So answering our test’s main question: YES, we can clearly see that the viewability data correlates with the number of conversions. Higher “Engaged visits, %” rate results in higher CR, lower “Engaged visits, %” rate means no or few conversions.
You can be sure that in case you don’t receive conversion data, you can optimize campaigns using your campaign’s Viewability Metrics.
A bit about the Viewability Pixel’s future
When the Viewability Pixel was just released, we got a lot of questions. Some of our experienced clients didn’t feel they needed additional tracking tools on top of their well-crafted systems. We totally understand that!
However, we believe that viewability metrics is the next step in providing our partners with performance-based advertising.
This is why we’ve started working on the “Audience 2.0” project that will be based on the Viewability Pixel and its metrics and will eventually give our partners the opportunity to create custom audiences of highly engaged visitors and target them easily.
We would really appreaciate if you could share your feedback in the comment section below or on our Telegram chat.
Stay tuned!
Trends
View more posts