Champions League Final Campaigns: Stats and Creatives
This post is also available in:
PT
ES
Last year’s Champion League’s Final brought 700 million viewers. 7 times more than what the 2022 Super Bowl managed to gather (112 million).
But, that’s a small number compared with the traffic volume generated by last year’s Champions Final top GEOs.
We’re talking about 10 GEOs that generated over 62 billion impressions! We don’t know about you, but this is definitely an event we don’t want to miss.
To make sure that you’re prepared and have your A-game ready for this major event, we checked with our geniuses some stats from last year’s Champions League Final.
We analyzed stats for the two weeks before Champions League 2021. For accuracy reasons we compared them with the first two weeks of May, of the same year.
To make things more interesting for you, we focused on more narrow targeting settings. So, we picked the most popular GEO and Vertical combos. And for each, we verified the best-performing formats and OS.
Because we always have your back, we also picked some creative examples and best practices for you.
2021 Champions League Final Top GEOs
First, we identified the 10 GEOs that had the best traffic volumes. Then we checked how they did the two weeks before the Champions League Final (15-29 May 2021).
This led us to the most interesting and attention-grabbing geos for the overall interest during the period.
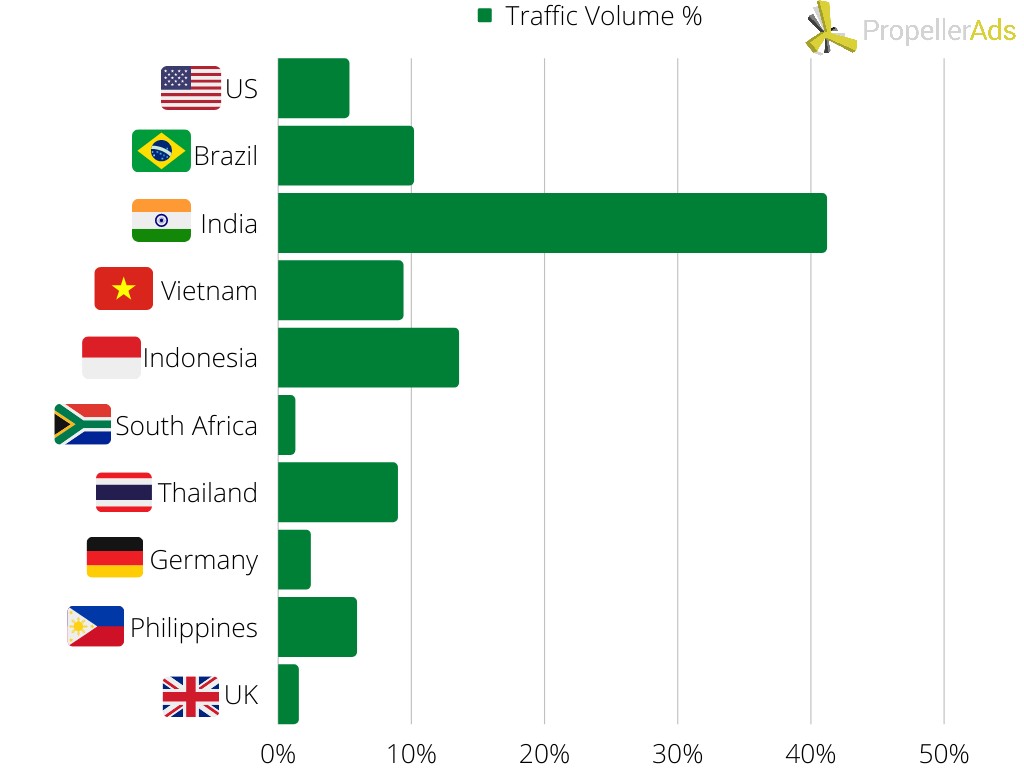
Below you can find them, in the order of their popularity according to our advertiser’s preferences:
As you can see, the main performer was India. In terms of popularity (coming in 3rd place) and traffic volumes. The country makes for more than 41% of the total traffic generated by the 10 “most wanted” Champions League Final 2021 GEOs.
In this report, we’ll focus on the top 5 performers. In terms of volumes, India was followed by Indonesia, Brazil, Vietnam, and lastly the US.
Narrowing Down the Champions League Final 2021 Targeting
For this part, we picked the most active GEO and Vertical combinations during the two weeks leading to the 2021 Champion League Final. We only picked the examples that gathered the highest traffic volumes.
And here’s what we found:
#1. US & Utilities
This lucky combo generated 1.6% of the total traffic brought by the main Champions League Final 2021 GEOs.
The Utilities vertical is particularly important during major sporting events. Mostly because people like to safe-proof their devices, make them faster, or improve their connection during big games.
• OS
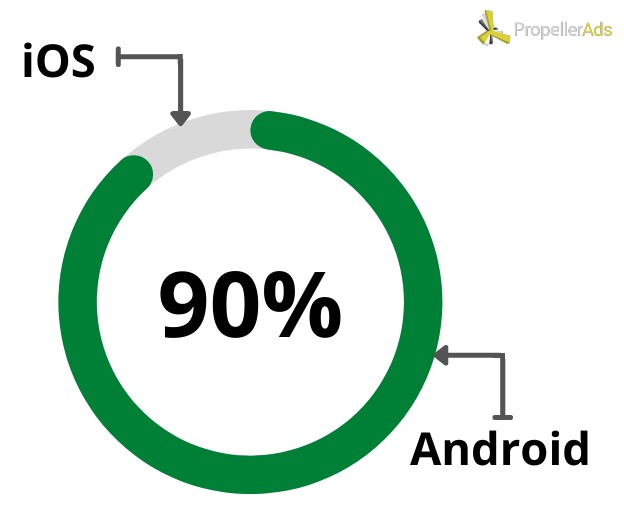
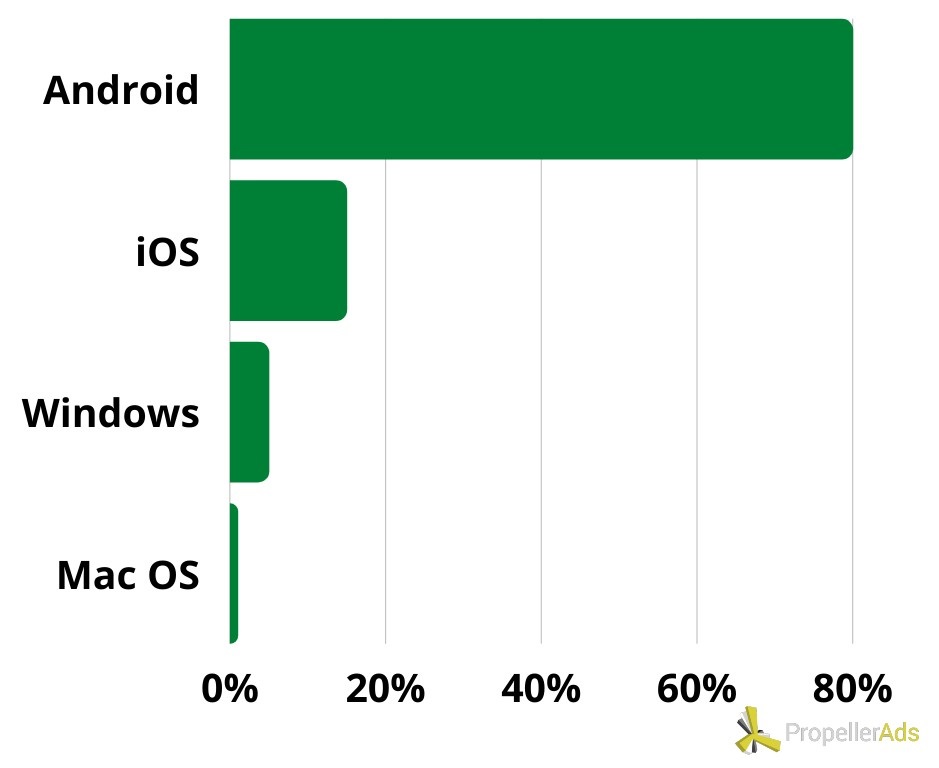
The battle in terms of traffic volume spikes was between iOS and Android. The latter led by far in traffic volume.
• Formats
Push Notification was the most preferred format to advertise for this fortunate combo.
• Creatives Best Practices and Ideas
For Push Ads, we noticed a strong accent on the content – straight forward message. But also including some simplistic graphic elements
Ads coming at the right time during big sporting events like the Champions League, have a lot more chances to end in conversions. So make sure to include either the appropriate offer, or the right content.
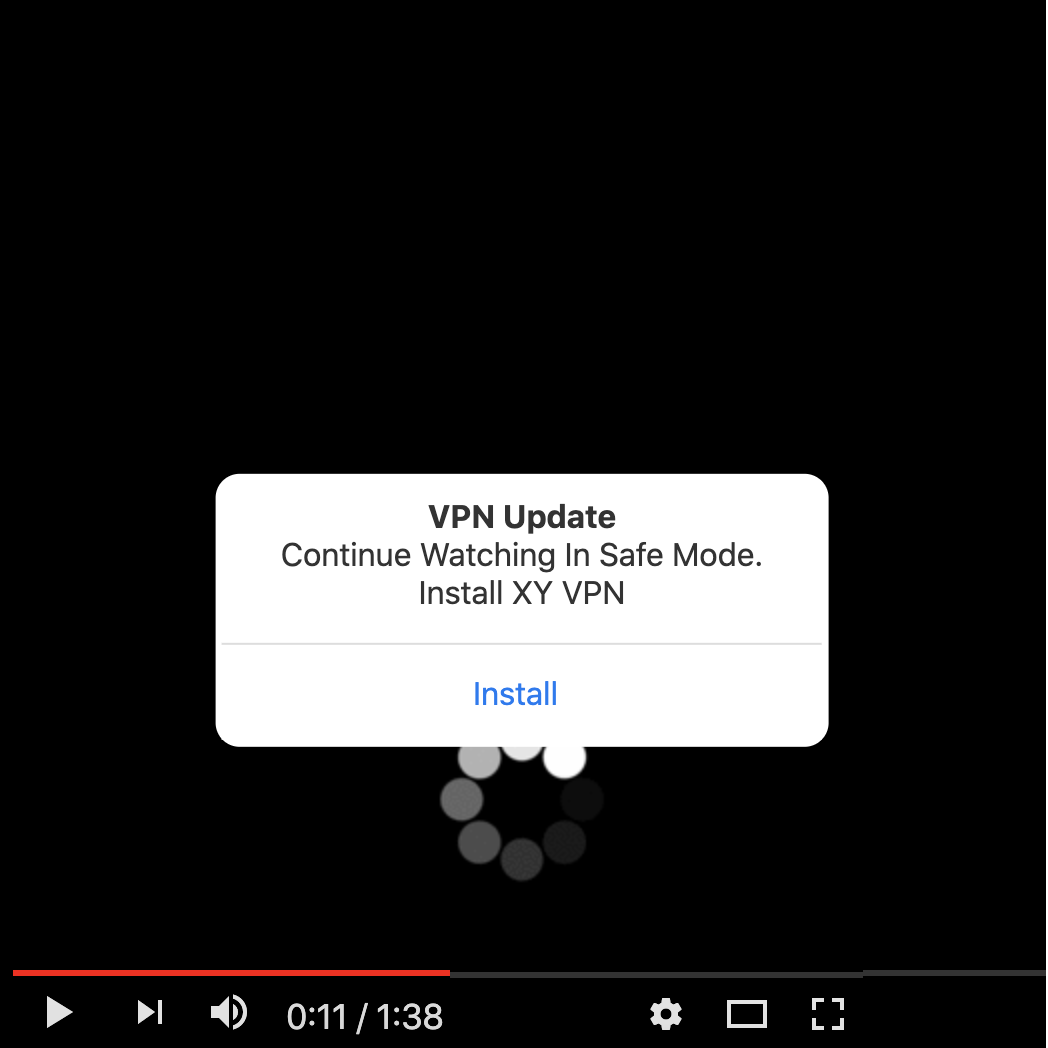
OnClick Popunder ads were also pretty popular. Their main characteristic was once again the straight forward message.
• Performance Comparison
To make sure this event generated more activity, we wanted to compare the traffic volumes to the ones from the previous two weeks (1-15 May 2021).
And the reality is that the two weeks leading up to the Champions League Final brought 14% more traffic.
#2. Brazil & Sports
This is a GEO truly worth targeting. Just consider that this year Brazil is only preceded by Spain, in terms of most players in this year’s Champions League Final (it’s 70, we checked).
And since the Sport vertical is huge in Brazil, the combo generated really good volumes – 0.28% from the total by GEOs.
• OS
Android leads the traffic volume battle for this vertical and GEO combo as well.
• Formats
OnClick was the top performer in terms of traffic volumes.
• Creative Best Practices and Examples
For this winning duo, we saw a preference for Popunders without pre-landers or leading straight to a home page.
• Performance Comparison
As it happened in the case of US and Utilities, Brazil and Sport also registered a 14% increase in the traffic volume. Obviously during the two weeks leading to the Final, compared with the first two weeks of May 2021.
Curious to know about more Sporting Events? Check our calendar
#3. India & Finance
This is the second-best performer when it comes to traffic volumes generated during the two weeks leading to the Champions League Final.
Finance generated the most spectacular volumes for India. As it has long been known that Finance and Sports Verticals go hand-in-hand.
And this stands to show that it doesn’t really matter what vertical you’re advertising for, as long as you know your business. As such, this GEO+Vertical combo generated 3.22% of the total volume per GEOs.
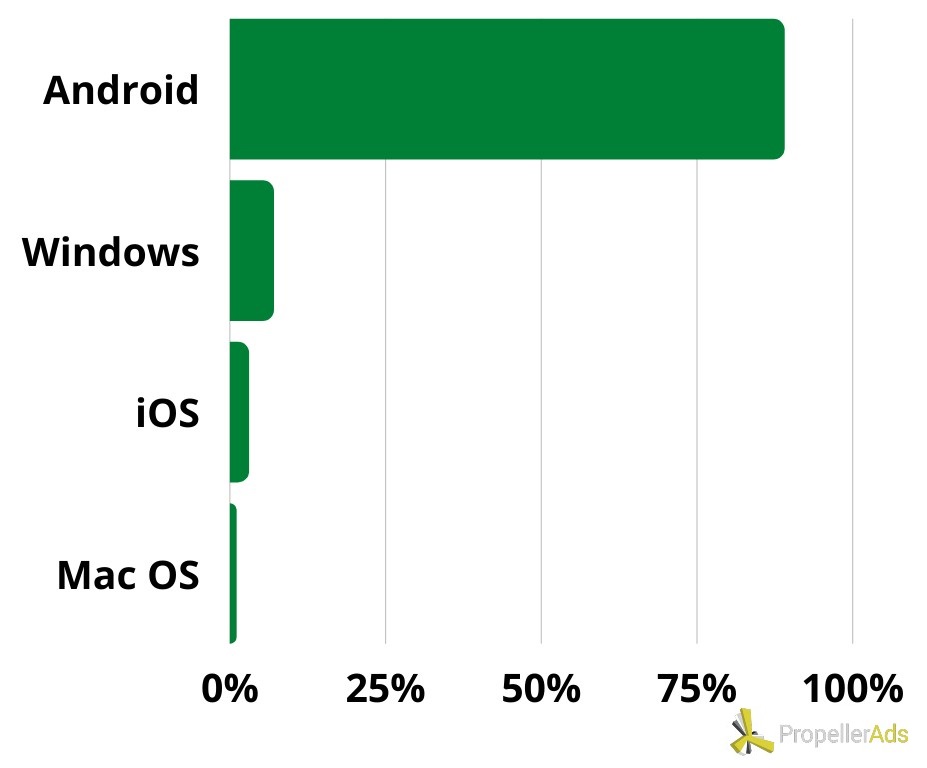
• OS
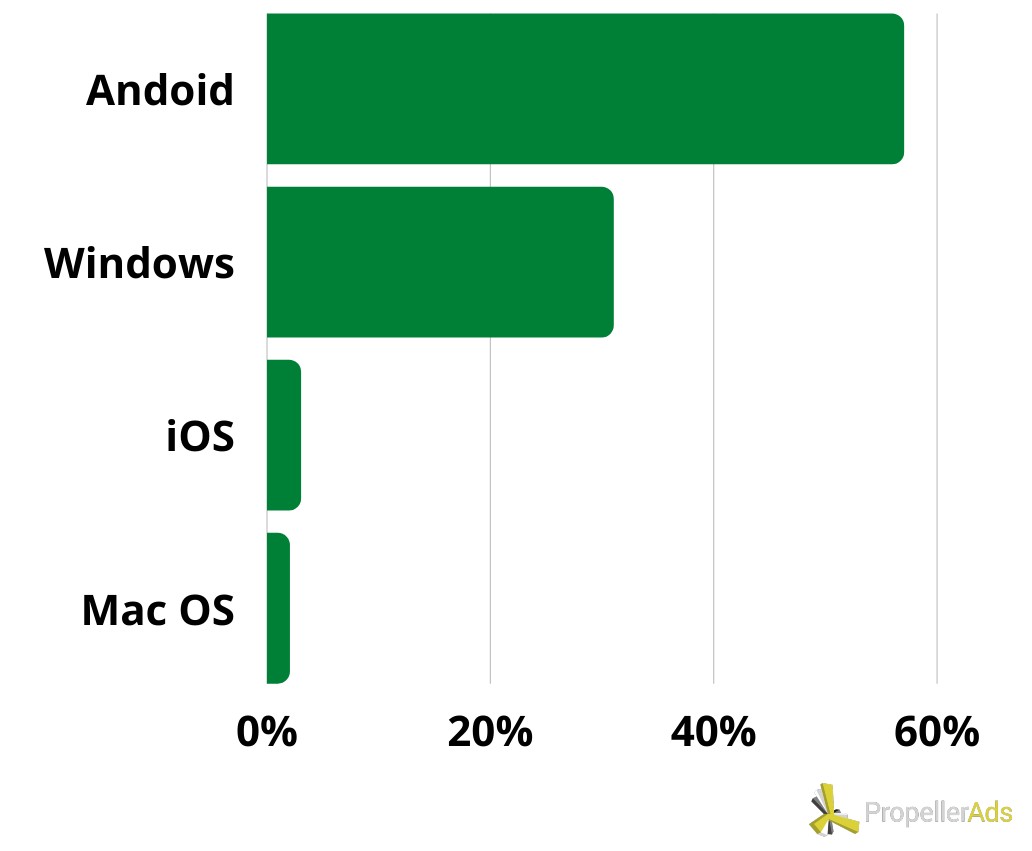
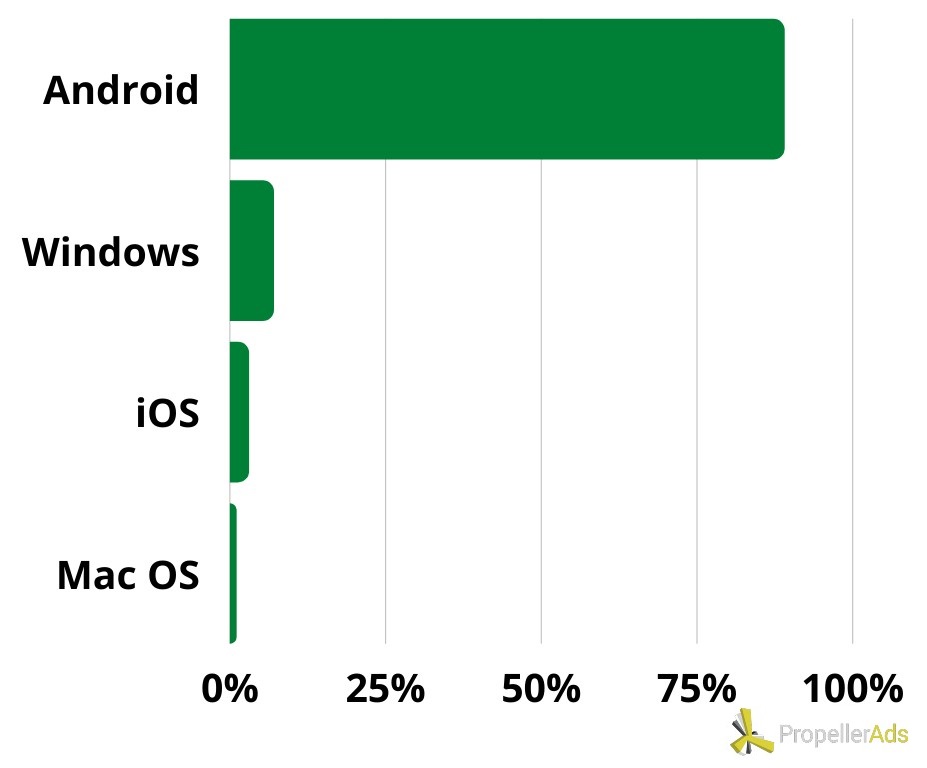
Hardly having any competition, Android took the lead – 98% of the traffic. But there were some other worthy mentions.
• Formats
Just as it happened with Android, Push Notifications also stole the spotlight in terms of India + Finance traffic volumes.
• Creatives Best Practices and Examples
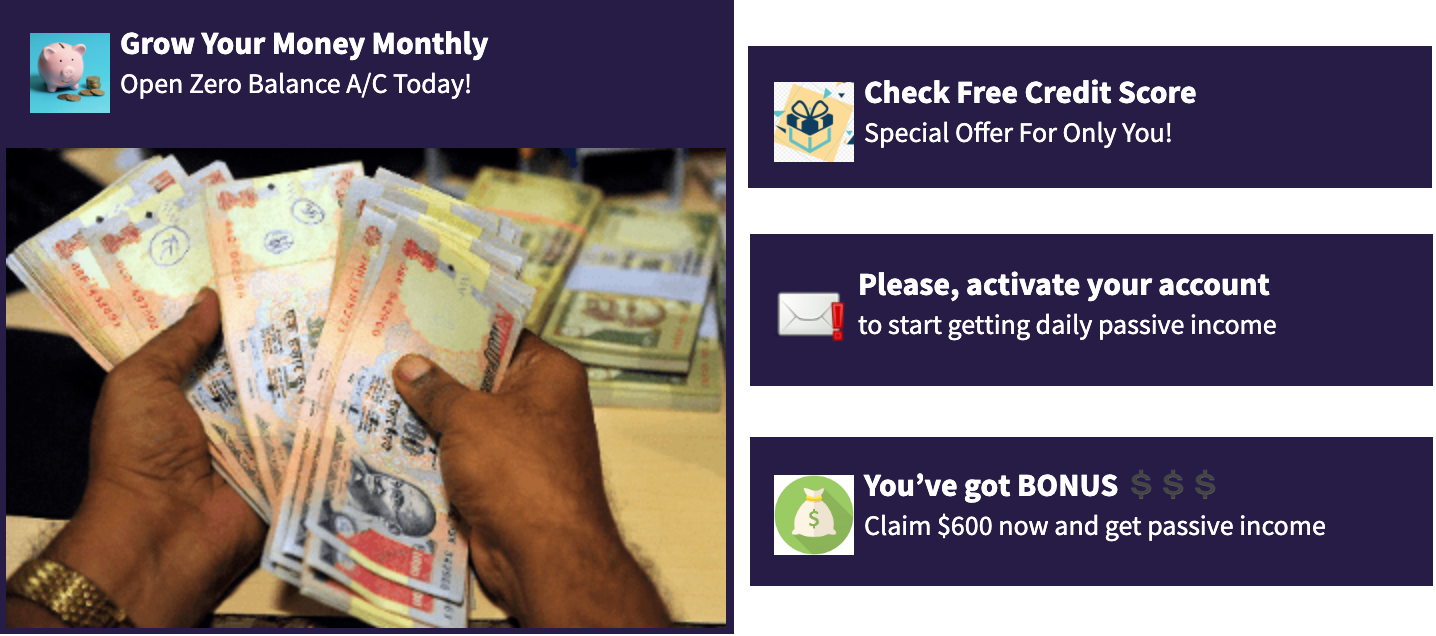
For India and Finance, we saw a preference for Push featuring local celebrities, or images with girls and money. Here are a few examples.
• Performance Comparison
And finally, we looked for some background data, and found that this combination resulted in more traffic. More specifically an 8% increase in traffic volume during the two Champions League Final weeks, compared to the previous ones.
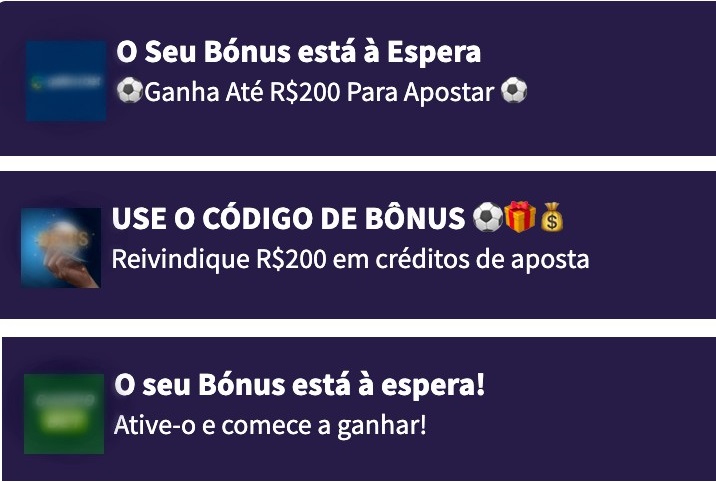
#4. Vietnam & iGaming
iGaming performed spectacularly for this GEO. And you will see that later in terms of how much traffic spiked during the two weeks before the Champions Final.
• OS
Android was pretty much responsible for most of the traffic generated by the Vietnam/iGaming combo.
• Formats
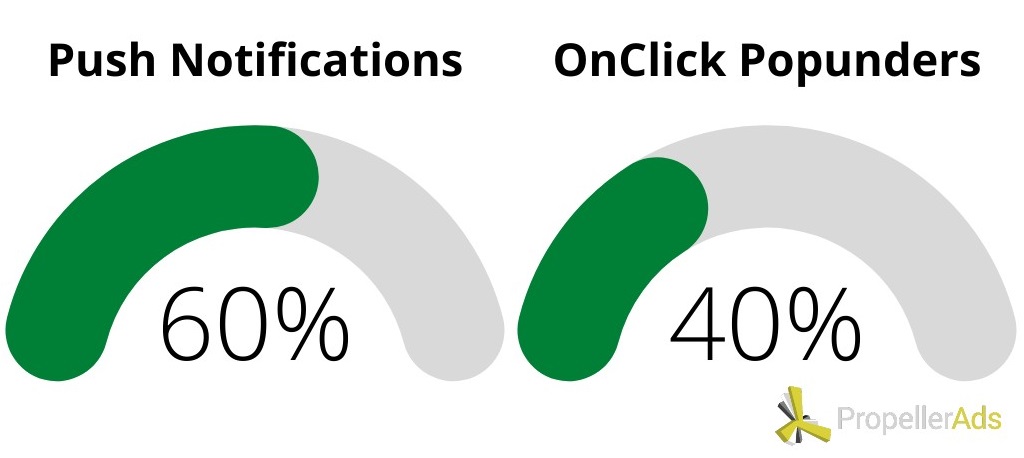
Here we see a bit of a more balanced situation, between Push and OnClick Popunders.
• Creative Best Practices and Examples
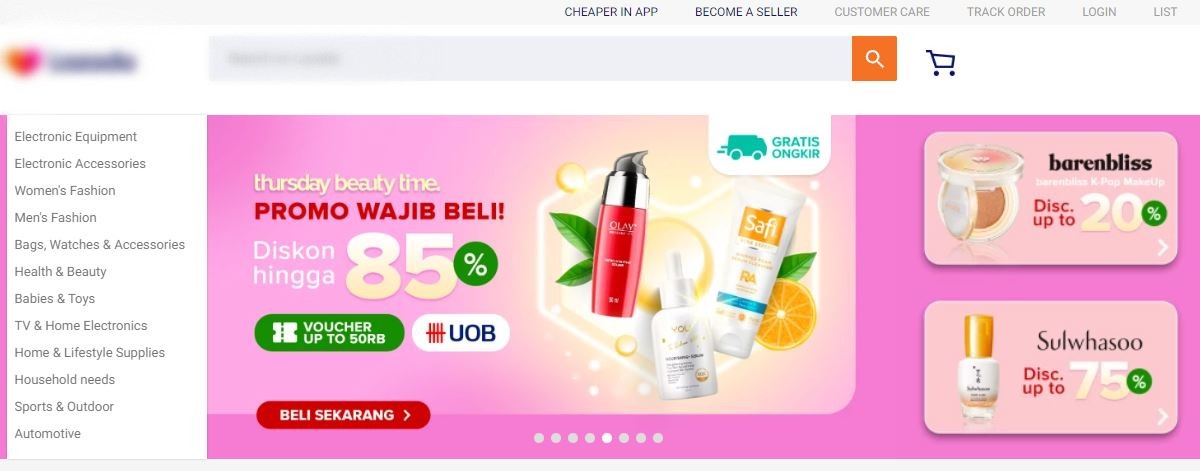
In terms of creatives, we see an accent on bright colors, attractive images, and flashy prizes. As for Popunders, advertisers use pre-landers with a registration form. Check out some examples:
• Performance Comparison
And you finally made it to the juicy part. Can you guess by how much the traffic volume skyrocketed two weeks before the Champions Final? Fine, we’ll tell you! Vietnam and iGaming saw a 35% hike in volumes!
#5. Indonesia & eCommerce
eCommerce is the heavyweight champion of traffic for Indonesia. And it shouldn’t come as much surprise, since you can always adapt your content to include special Champions League Offers. But that’s not all.
As traffic usually spikes during major events, so does the users’ attention for memorabilia, related products for the event, or event offers that have nothing to do with the actual event.
As people are caught in the heat of the Final, they are more prone to go for impulsive shopping. Or spending without thinking too much.
So, as long as your offer is appealing enough, the event rush will help get impressions, clicks, or even conversions.
• OS
Android was the most popular OS for Indonesia and eCommerce, as well.
• Formats
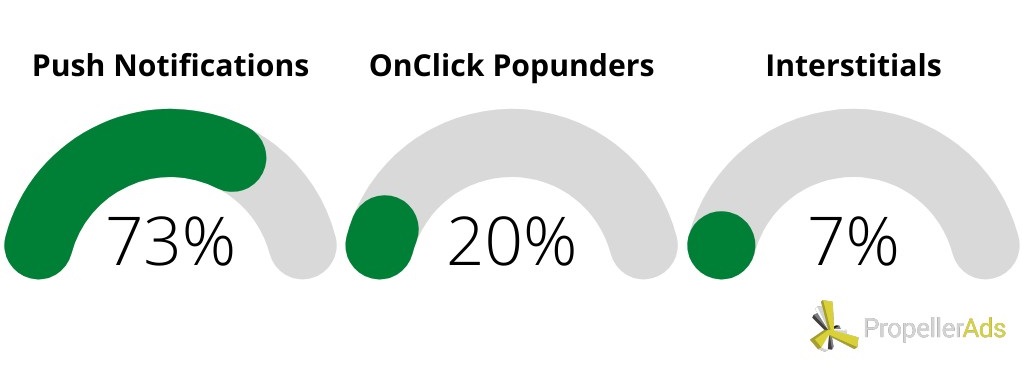
By far, Push Notifications took the lead in traffic volumes for this lucky combo too.
To show that the adrenaline and excitement of the Champions League Final really do help users react more to shorter and more dynamic formats.
• Creative Best Practices and Examples
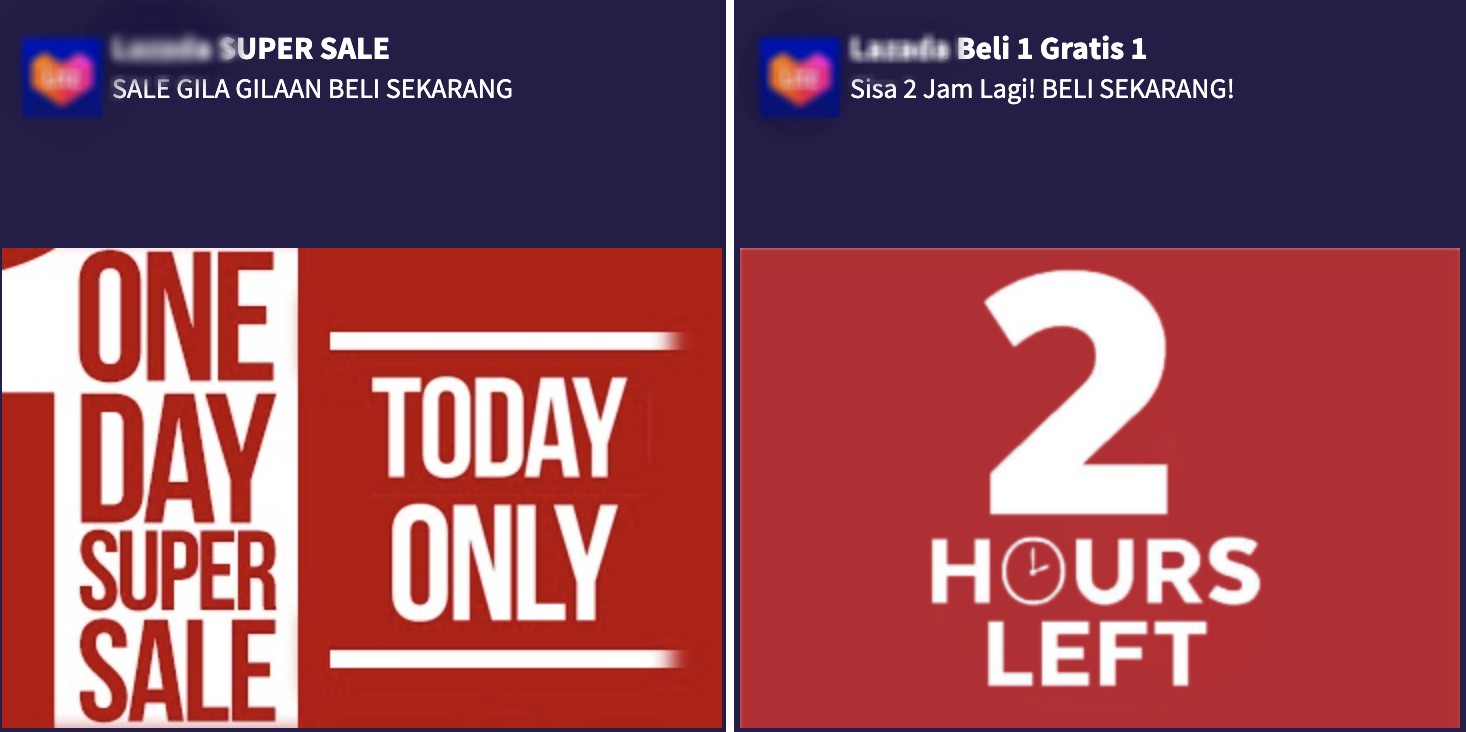
Push Notifications mostly prevail when it comes to sales announcements, discounts, and available coupons. Their design can also remain pretty simplistic, as the message and colors do their job.
And even if you don’t include Champion League-related products or offers, a simple offer deadline can just as well do the work for your campaign.
Popunders and Interstitials also appear as very flashy promotions, filled with colors and merry discounts. Often Popunders are just a homepage.
• Performance Comparison
How would you like a 13% increase in Indonesia and eCommerce traffic volumes? Just fine!
Then you have to target this combination before the Champions League Final, as this is exactly what we saw last year.
The optimal time settings to launch your campaign
Based on last year’s data, we suggest you follow the game schedule. And as we saw in the previous pandemic-affected events, plan ahead, and launch your campaigns at least two weeks in advance.
But also keep in mind to increase your budgets ahead of the big game.
Also, if you usually use time-settings for your campaigns, for these ones you might want to skip this setting. Your campaign will enjoy plenty of time, to take the most from the event.
And remember, the right offer (special Champions League Final discounts, promotions, or offers, expiry) plays an essential role. Regardless of the vertical.
But you can also get pretty good results advertising before and during the Champions League Final. This can either happen because of the general surge in traffic (more traffic online – more chances for you to get impressions, clicks, or engagement).
Or simply because of the users’ change in perceptions during events with a high emotional impact. Psychology does really work, if you know how to use it right.
Well, there you have it! We hope this article gave you a pretty solid idea of what to consider for this year’s Champions League Final Campaigns.
If you need more help, or advice, come chat with us on Telegram.
